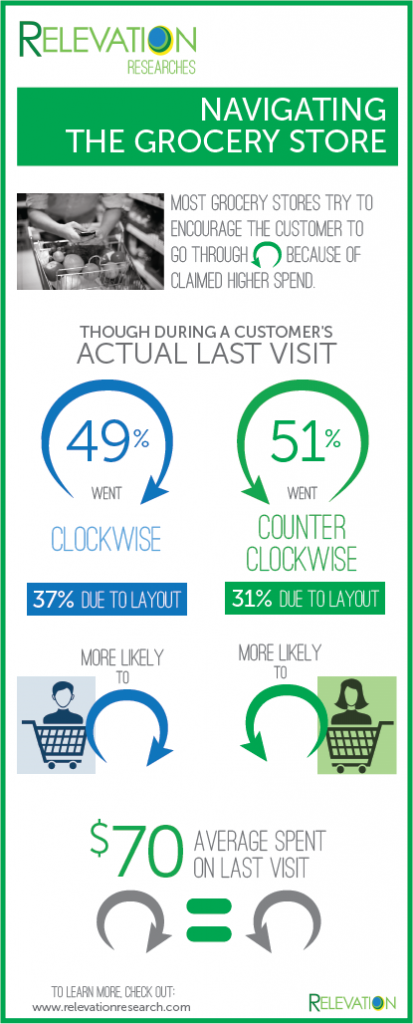
Much has been said and written about how the average grocery basket is higher among those who navigate the store going counter-clockwise versus those who take a clockwise path. This has been hypothesized to be the effect of the side of the road we drive on and our psychological comfort, a right brand expressive state, and/or since being right-handed is more common, a greater ease of grabbing and loading the basket. But when Relevation polled a representative sample of shoppers about 1,800 past month grocery trips across 12 different channels/types of channels, here’s what we found:
3 posts Posts by Rachel Strasser
Subscription Boxes Boom
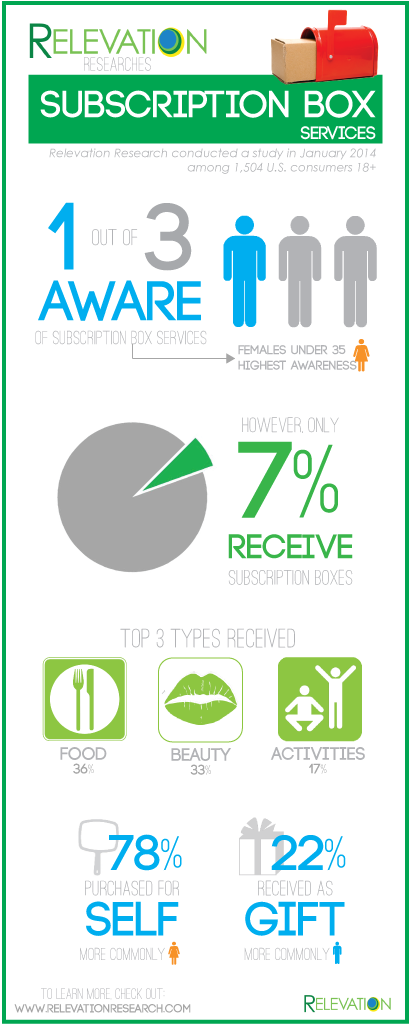
Subscription box services, where a recipient receives a package with surprises by mail every month, every other month, seasonally or quarterly have become quite a trend since their debut in 2010. There is one for almost any interest; some of which include pets, food, fruit, wine, beauty/fashion, babies/toddlers, fitness, men’s supplies, sustainability, books, etc. But who is getting these boxes and what kinds?
Relevation Tips: How to make a clean report
Our data visualization expert has three top tips for creating a clean report. However, it is important to remember that in writing a report you must first find the story, then do your analysis homework, and finally support those findings.
#1 Be Consistent Slide to Slide
- Use theme colors and templates
- Use the same font, even within the charts and tables
- Make the size of the charts and tables the same throughout the report
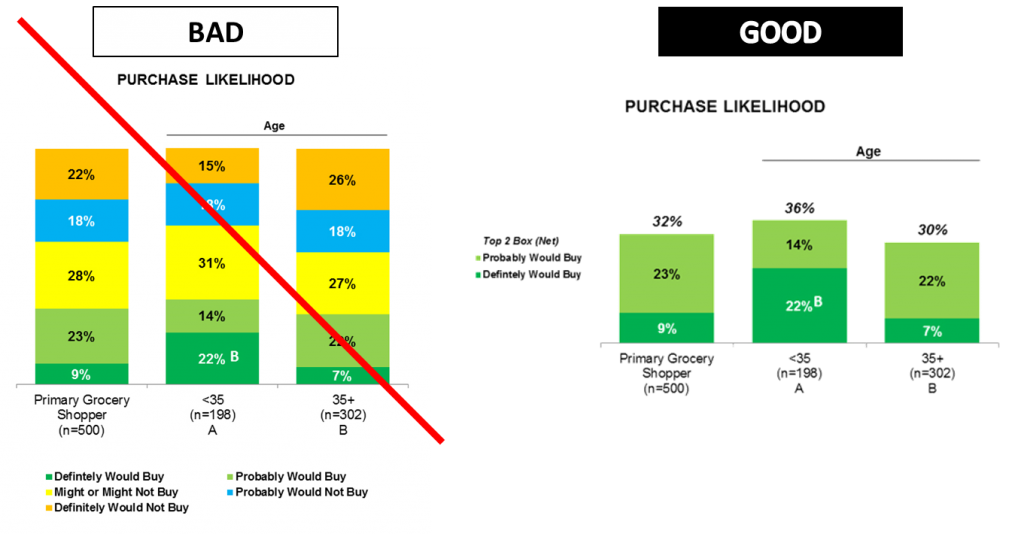
#2 Keep Charts Organized and Simple
- Legend should follow order of bar –
- If vertical bars, legend should also be vertical and clearly visible to LEFT of bars
- If horizontal bars, legend should also be horizontal and clearly visible at TOP of graph
- Only show necessary data. Avoid showing every point of each scale, when possible show only a summary.
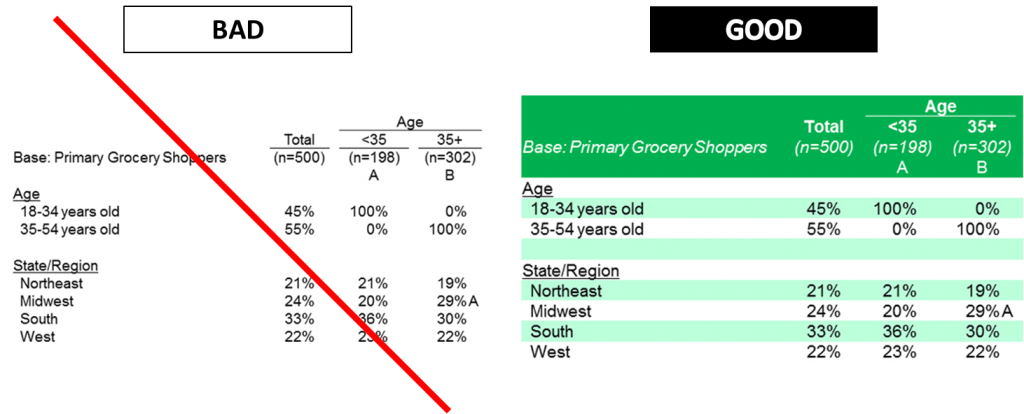
#3 Make Tables Easy to Read
- Rows should be easy-to-read and distinguishable from each other.


