10 articles Articles posted in Marketing Research (General)

One Liver Breakfast Biscuit, Please!

As pet pampering continues to explode with monogrammed bedding, massages & spa treatments, creative grooming, organic food & treats, Relevation explored the number and nature of QSR outings for the dog in a recent nationally-representative online poll. Close to one third of dog owners take their lucky pup to one or more popular QSRs to enjoy a snack or meal with the average number of chains visited 2.9. The number of claimed visits total over 1 Billion trips annually.

dogsStarbucksTreat

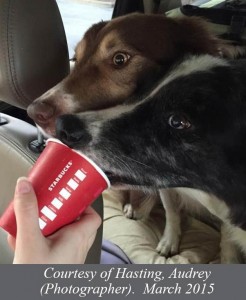
Over two fifths order food and drinks directly off the regular menu for the dog (if you call “Puppuccino” at Starbucks off the regular menu).

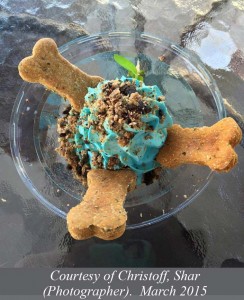
But one in four are ordering specialty designer type dog goodies at restaurants that cater to the pooch.  Current offerings such as the Pup Cup, Bag O’Bones, Pup Cakes, Pooch-ini are growing in popularity.  Some are offered gratis; others go for as much as or more than regular menu items.
DoggieSundae2According to the 2013/14 APPA National Dog Owners Survey, there has been a gradual decrease in purebreds. Rescue has become the new fad with empty nester owners eager to make it up to the dog for his rough start in life.

The way to the dog owner’s heart (and wallet) is through the dog’s stomach. QSRs can capitalize on this and make themselves the go-to destination for doggie visits.

Just For Laughs

A physicist, a chemist, and a market researcher enter the lab.  Shortly after entering, they are alarmed to see smoke and fire coming from a wastebasket.

dreamstime_xs_26199175The physicist says, “I know what to do! We must cool down the materials until their temperature is lower than the ignition temperature and then the fire will go out.”

The chemist says, “No! No! I know what to do! We must cut off the supply of oxygen so the fire will go out due to lack of one of the reactants.”

While the physicist and chemist debate what course to take, they are shocked to see the market researcher running around the room starting other fires. They both scream, “What are you doing?”

To which the market researcher replies, “Trying to get an adequate sample size.”

I Want My Steak “Made in America” But My Wine Can Be From Italy

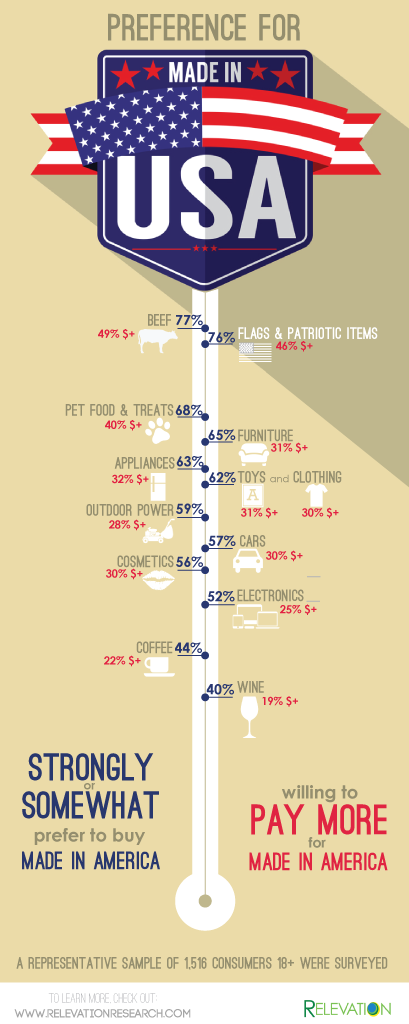
Preference for “Made in America” differs by product category based on some research we recently conducted among a representative sample of U.S. consumers.  Domestically-produced goods claim to be preferred most for Beef, Flags & Patriotic Items and Pet Food & Treats, with preference least in terms of Wine.

Preference is stronger than average among . . . 65+, those in the South, Caucasians, and those in households with members now or previously serving in the U.S. Armed Forces.
Coffee netted the highest percentage of all categories with consumers preferring products made outside America, but at only 10%.
ARR_blog_MadeInAmericalthough no differences were noted Females versus Males overall, Females are more passionate about “Made in America” in conjunction with several specific categories: Beef, Pet Food/Treats, Cosmetics, Electronics, Home Appliances, Clothing, Toys, Wine, Furniture and Patriotic Items.

Preference for “Made in America” is eroded somewhat, although it remains strong, if the price tag increases.

Does the Direction You Shop for Groceries Really Matter?

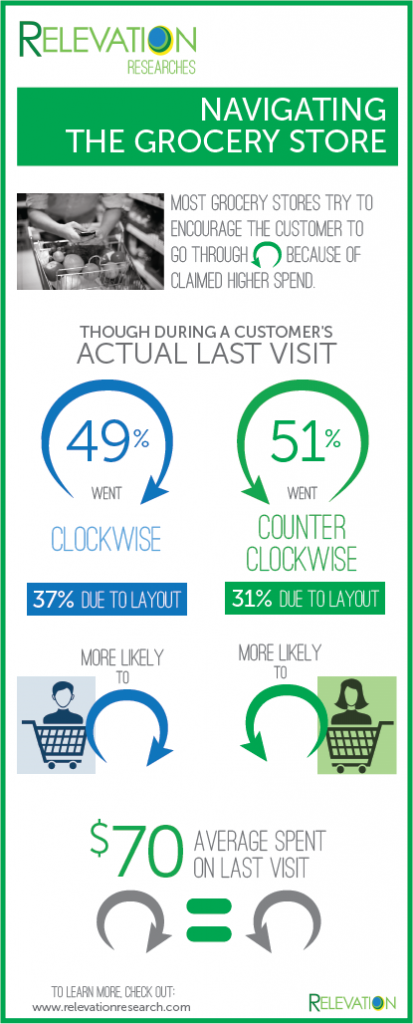
Much has been said and written about how the average grocery basket is higher among those who navigate the store going counter-clockwise versus those who take a clockwise path. This has been hypothesized to be the effect of the side of the road we drive on and our psychological comfort, a right brand expressive state, and/or since being right-handed is more common, a greater ease of grabbing and loading the basket.  But when Relevation polled a representative sample of shoppers about 1,800 past month grocery trips across 12 different channels/types of channels, here’s what we found:

RR_blog_GROCERY_1020

ALS Challenge – The Cold Facts

From July 29 to August 29, 2014,  the ALS Association received over $100 million dollars in donations due to the Ice Bucket Challenge. In the same time period a year ago, the association raised just $2.8 million. ALS_960w

The Challenge was spread through Facebook and television according to a recent survey*. Overall, 9 out of 10 Americans polled were aware of the Challenge with 44% of them learning of it through Facebook. Younger groups heard of it on Facebook significantly more often — 77% for those age 18-24 and 68% age 25-34 — while older people heard of it via television — 48% age 50-64 and 59% age 65+.

nevALS

Of the 90% that knew of the Challenge, 11% actually poured the water over their head. One of them was the daughter of our own Shulie Packer. Good going!

*Source: Polaris Marketing Research (9/3/2014)